Monthly statistics on the international trade in goods, July 2025
29.9.2025 9.00
Finnish Customs, Statistics
Volume of exports increased 27.0 per cent; volume of imports increased 3.0 per cent in July
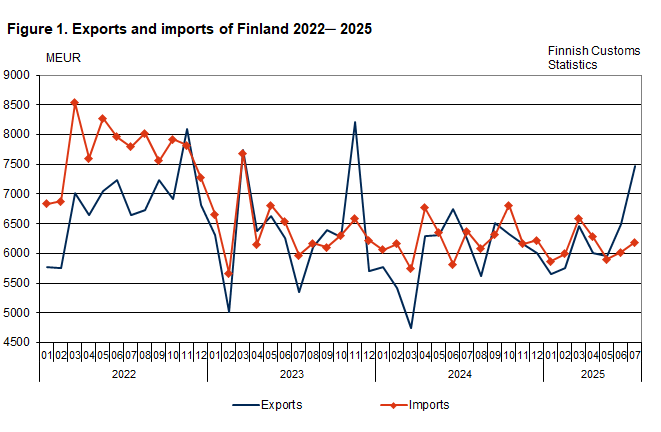
The value of Finnish exports of goods increased by 19.7 per cent year-on-year in July, according to the international trade in goods statistics provided by Finnish Customs. The value of Finnish exports was EUR 7.5 billion. Export volume increased by 27.0 per cent and export prices declined by 5.6 per cent year-on-year. The value of imports decreased by 2.8 per cent in July to EUR 6.2 billion. Import prices declined by 3.2 per cent and import volume increased by 3.0 per cent compared to July 2024.
In January-July, the total value of exports increased by 5.5 per cent and the value of imports decreased by 1.0 per cent compared to the corresponding period of the previous year. Change of export volume during the latest 12 months was +1.0 per cent (12-month moving average August 2024 – July 2025). The corresponding figure for import volume was also +1.0 per cent.
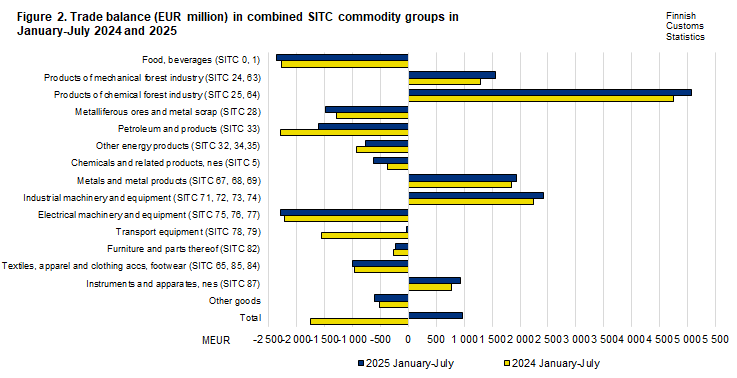
In July 2025, the trade balance showed a surplus of EUR 1.3 billion. In January-July 2025, the trade balance had accumulated a surplus of EUR 965 million. The aggregate trade surplus by commodity group increased for industrial machinery and equipment, metals and forest industry products. The deficit increased for ores and metal scrap, chemicals and related products, foods and beverages and electrical machinery and equipment, but decreased for crude oil and refined petroleum products.
The terms of trade deteriorated in July compared to the corresponding month of 2024 as export prices declined more than import prices. The point figure in July was 97.4, while it was 99.9 in July 2024. The terms of trade deteriorated also from June 2025.
Value of exports of transport equipment and parts increased in July
The value of exports of industrial supplies decreased by 9.3 per cent in July and the value of exports of capital goods by 6.7 per cent year-on-year. The value of exports of fuels and lubricants decreased by 22.5 per cent. The value of exports of consumer goods declined by 26.9 per cent, but the value of exports of food and beverages increased by 2.9 per cent. The value of exports of transport equipment and parts multiplied mostly due to a cruise ship delivery to the United States.
The value of imports of industrial supplies decreased by 7.4 per cent in July, but the value of imports of capital goods increased by 2.7 per cent year-on-year. The value of imports of transportation equipment and their parts declined by 7.7 per cent. The value of imports of fuels and lubricants decreased by 4.3 per cent. The value of imports of food and beverages increased by 5.0 per cent, but the value of imports of consumer goods decreased by 1.1 per cent.
Exports to non-EU countries increased in July
The value of exports to EU member states decreased by 7.2 per cent, but the exports to other countries increased by 51.8 per cent in July. Imports from EU countries increased by 4.1 per cent, and imports from non-EU countries by 1.1 per cent in July.
In January-July, total value of exports to EU countries increased by 0.7 per cent and exports to countries outside the EU by 12.2 per cent. In the same period, import value from EU countries decreased by 0.3 per cent and from countries outside the EU by 1.9 per cent.
| Direction | July 2024 | July 2025 | Change % | January-July 2024 | January-July 2025 | Change % |
|---|---|---|---|---|---|---|
| Exports (fob) | 6 241 | 7 470 | 19,7 | 41 514 | 43 797 | 5,5 |
| Imports (cif) | 6 369 | 6 188 | -2,8 | 43 255 | 42 833 | -1,0 |
| Balance | -128 | 1 281 | -1 740 | 965 |
| Indices | July 2024 | July 2025 | Change % 2025:07/2025:06 |
Change % 2025:07/2024:07 |
Mean* 2024:08-2025:07 |
Change % 2024:08-2025:07/ 2023:08-2024:07 |
|---|---|---|---|---|---|---|
| Volume index exports | 95,9 | 121,8 | 18,5 | 27,0 | 96,6 | 1,0 |
| Volume index imports | 91,3 | 94,1 | 5,6 | 3,0 | 91,1 | 1,0 |
| Unit value index exports | 136,0 | 128,3 | -2,9 | -5,6 | 133,1 | -0,8 |
| Unit value index imports | 136,1 | 131,7 | -2,3 | -3,2 | 134,7 | -0,2 |
* Moving 12-months averages
Terms
Next release
30.10.2025
Graphs