Impact of the change in the data collection method for imports on the international trade statistics of goods
Finnish Customs started using export data collected by other EU Member States for compiling statistics on imports of goods from EU countries starting from the statistical year 2026. This export data from other Member States have completely replace the data previously collected from Finnish import companies. From the statistical year 2026 onwards, the reporting obligation for intra EU trade has been eliminated for imports and will apply only to EU exports. There were no changes to data collection for trade with non-EU countries; the primary data source is customs declarations.
Preliminary statistics for international trade in goods from 2026 onwards will be published no later than 40 days after the end of the statistical month, which is about two days later than before. The publication date for the preliminary data for January is 12 March 2026, and these will be the first international trade statistics on goods produced using the new data collection method. Detailed data will be published on 30 March 2026.
The change in the data collection method for EU imports will result in changes to detailed import figures by country of origin and by different classifications, but the aggregate level of import value remains consistent with the previous method. Almost all country and goods distributions will change when it comes to imports.
Impact of the methodological change on publications
The first international trade statistics compiled using the new data collection method or MDE-data (Micro data exchange), which other member states have collected, will be published in March 2026.
- Until the statistical year 2025, data will be published only according to the old method, and only one set of official figures will be released. Starting from the statistical year 2026, the data will be published using the new method.
- The import values or quantities for 2026 are not comparable with the previous year's data, except at the total aggregate level. During the statistical year 2026, Finnish Customs will not publish percentage changes of imports by country, by country group or at lower levels of classifications, percentage changes will be published only at the total value level.
- Nearly all commodity codes and most countries will have changes in values and quantities, except if a commodity code includes only imports from countries outside the EU.
- Of international trade unit value- and volume indices 2025=100 data are published, where the reference year and weight structure are also calculated with data collected with the new method. The percentage changes are comparable also in imports.
- In the Uljas database, there is a new cube that contains all export data for 2025-2026 and import values and quantities for 2026.
In transport statistics, the mode of transport for the import is recorded when the goods arrive in Finland; usually by sea. Information on the mode of transport is received from other EU countries when the goods leave, which is often by road. Sweden for example, does not collect any data on modes of transport. The publication of the transport mode of import in the transport statistics will be discontinued, i.e. the transport statistics will be published only for exports from the statistical year 2026 onwards.
The MDE data does not include the locations of Finnish import companies, so the Customs publication on regional statistics only includes export data by region from the statistical year 2026 onwards.
Changes to import suppressions resulting from the methodological change
The new method also affects confidentiality in imports since each EU Member State determines their own commodity code suppressions for exports. Commodity code suppressions for imports granted by Finnish Customs earlier will also remain in force throughout the statistical year 2026. In practice, this means that there will be more suppressions on commodity code level and in different classifications than before in the information published by Finnish Customs about imports.
Differences at the aggregate value level of imports resulting from the methodological change
In statistics, the EU import data for January-November 2025 have been studied by comparing published statistical values and MDE (Micro Data Exchange) data sent by other countries. At the aggregate level, the data on Finland’s imports from EU countries correspond well with each other, but the more detailed the classification level becomes, the greater the differences are.
At the monthly level, the differences between the data collected through the Intrastat system and the MDE data are small at the aggregate level. Cumulative values reduce the differences even further, so as the annual level is approached (January–November 2025), the difference in the statistical value was only –0.03 per cent, or approximately 19 million. The value of the MDE data was higher than the value of the data collected with the Intrastat system.
When comparing the MDE data with the self-collected data, timing differences emerge. The MDE data have been collected from export declarations submitted in various countries, because of which a small portion of the declarations fall under a different month than they would have when Finnish companies submitted their import declarations. Over the course of the year, the differences even out, but some timing related discrepancies remain because no adjustment is made at the turn of the year.
Changes in the country-of-origin data resulting from the methodological change
More detailed information on the country of origin of the goods has previously been published in the MDE data. The MDE data are based on information provided by the exporter of the goods, who often has better knowledge of the country in which the goods were manufactured than the importer. Goods have been imported from EU countries whose country of origin is often a non EU country, but in some cases also another EU country than the one from which the goods were sent to Finland.
As a result, the share of goods originating in the EU or in non-EU countries changes, with the share of total imports of goods originating in EU countries decreasing. In the January–November 2025 analysis, the share of EU countries decreased from 58.5 per cent to 55.6 per cent, while the share of non EU countries increased correspondingly from 41.5 per cent to 44.4 per cent.
The import values of non-EU countries increase with the implementation of MDE data. In the background is the so called Rotterdam effect, the impact of which decreases in imports with the introduction of the new method. The Rotterdam effect refers to situations in which goods arrive to an EU country from a non-EU country and is declared there. After the goods are cleared, they are exported as intra-EU trade to another Member State. The importing company does not always know the country of origin of the goods and has therefore declared the country of dispatch as the country of origin. The importer in Finland may also have reported as the country of origin the country of the most recent loading of the goods, for example the country from which the vessel departed. There will be no changes to the export statistics concerning country of destination.
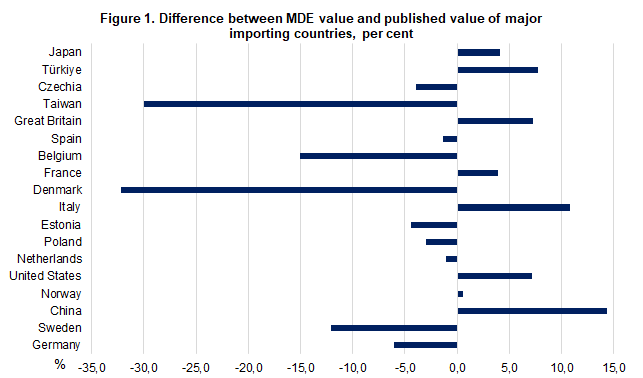
The countries with the largest positive differences in euros between the MDE dataset and the Intrastat dataset in extra EU trade are China, the United States, and Vietnam. Among EU countries, the shares of Italy, Romania and France are increasing. In EU trade, the shares of Sweden, Denmark and Germany decrease the most, but the share of several other EU countries as the country of origin also decrease.
Differences in import data at more detailed classification levels resulting from the methodological change
The differences between MDE and Intrastat data are more pronounced at the lower levels of all classifications. The more detailed the classification level being examined is, the greater the differences become. At the most detailed classification levels, there are differences in the statistical values and quantities, which can result in large discrepancies.
The data has been collected with the most precise CN classification (Combined nomenclature) in both materials. The most detailed level in the CN classification is the 8-digit level. All data are aggregated to the higher levels of the classification or converted into other classifications based on the CN8 classification. More information of all classifications Finnish Customs publish is to be found at the webpage: Nomenclatures and classifications.
In the analysis, the MDE data were compared with the published Intrastat data. In total, there are approximately 8,900 distinct CN categories at the 8 digit level in the examined dataset for January–November 2025. In total, there were 9,778 CN8 categories at the most detailed level in 2025. Not all categories necessarily had any imports to Finland.
The value of the unspecified categories decreases significantly because the Finnish Tax Administration’s OSS data are allocated to their own CN8 codes instead of being included in unspecified categories. This increases the value of several CN8 categories. Another factor contributing to the differences is the CN8 codes reported in the declarations, which often differ between the MDE data and the Intrastat dataset. The interpretation of the commodity codes is not always unambiguous for declarants. The Finnish importers and exporters in EU countries has often landed on an adjacent code in their interpretation of CN 8-digit commodity codes.
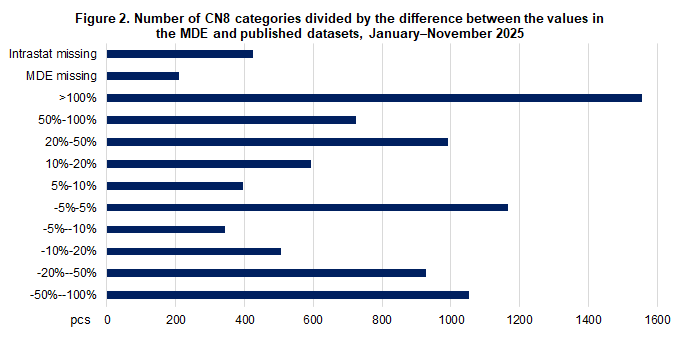
At the CN 8-digit level, there are more than 400 pieces CN8 categories for which data were found in the MDE dataset but which were empty in the Intrastat data. In the Intrastat dataset there were more than 200 categories for which data were available, but for which no data exist in the MDE dataset. The largest number of changed CN8 categories is found in the group where the value changes by more than 100 per cent, and the second largest in the group where the change falls between –5% and +5%. Values were almost identical only for electricity and pipeline gas, whose data collection remained unchanged.
Since the MDE data are received in FOB value, the value is converted to CIF in the statistics using conversion coefficients. For this reason alone, an identical value in the MDE and Intrastat data is not a guarantee that the MDE statistical value corresponds to the published figures.
Among the import categories with the highest value, the fewest discrepancies are found in fuels. The largest differences are found in transport equipment, metals, and metal goods, as well as industrial machinery and equipment. In Chapters 84 (machinery and mechanical appliances) and 85 (electrical machinery and equipment), there are many parts for which the CN8 codes can be open to interpretation.
Other classifications
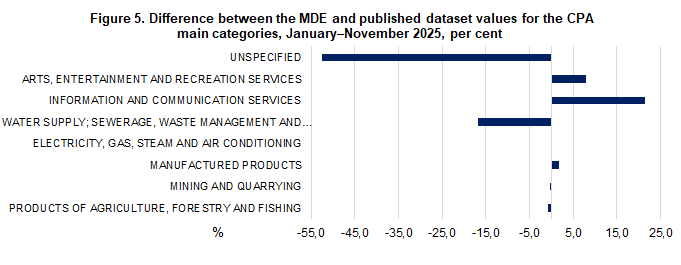
Finnish Customs also publishes international trade data with other classifications. SITC, CPA and BEC are the most commonly used classifications. The change in the data collection method also affects the import values in these classifications, because the data are converted from the CN classification using correspondence tables.
The largest single factor explaining the differences in the values of the other classifications between the MDE data and the published data was the reduction in the share of unspecified categories, as the Tax Administration’s OSS data are no longer recorded under unspecified categories but are instead allocated to different commodity codes. These data are now obtained from the MDE dataset by CN8 category. The remaining differences are due to discrepancies in the declaration data derived from the CN8 classification.
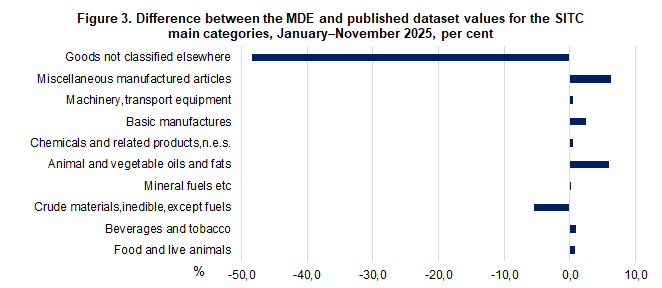
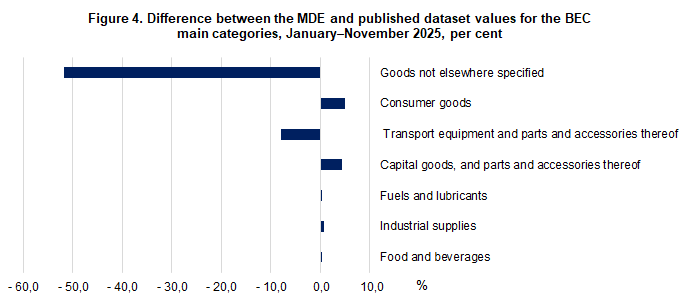
Figures 3–5 below show the differences between the MDE and published datasets for the SITC, BEC and CPA main categories, expressed as percentages of the published data.
Summary; reasons why discrepancies will continue to occur
With the new data collection method, Finland’s import data from EU countries will be based on information from around 30,000 companies starting from the statistical year 2026. With Intrastat import data collection, Finland’s import data from EU countries were based on information provided by about 5,000 Finnish companies on their EU imports up to the statistical year 2025.
The Intrastat export declarations submitted by other EU countries do not always fall in the same month as the import declarations submitted in Finland, which results in timing differences.
For country-of-origin data, the MDE data are more reliable, but there are many discrepancies.
The OSS import data have been allocated to CN8 codes and are no longer classified under unspecified categories.
Large differences in values and quantities at the CN8 level; often the adjacent code.
During the 2026 statistical year, comparability in imports at the lower levels of classifications or in country-of-origin data will not be possible, only the aggregate value level will be comparable.
Enquiries:
Telasuo, Christina tel. +358 40 332 1828
Penttilä, Olli-Pekka tel. +358 40 332 1862
E-mail: statistics[at]tulli.fi