Monthly statistics on the international trade in goods, March 2026
28.5.2026 9.00
Finnish Customs, Statistics
Volume of exports increased 6.9 percent and volume of imports 5.7 per cent in March
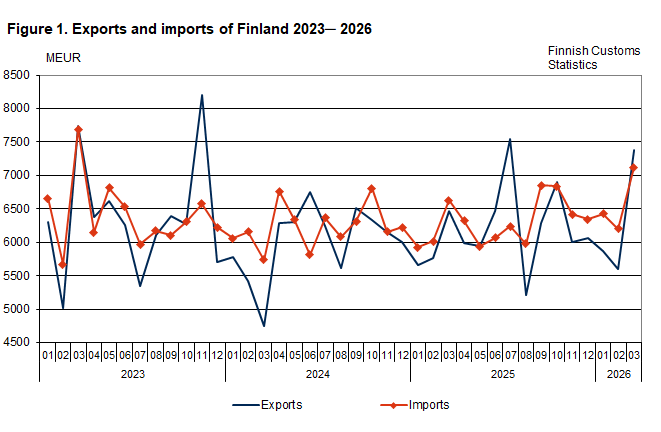
The value of Finnish exports of goods increased by 14.0 per cent year-on-year in March, according to the international trade in goods statistics provided by Finnish Customs. The value of Finnish exports was EUR 7.4 billion. Export volume increased by 6.9 per cent and export prices increased by 6.8 per cent year-on-year. The value of imports increased by 7.4 per cent in March to EUR 7.1 billion. Import prices increased by 2.0 per cent and import volume by 5.7 per cent compared to March 2025.
In January-March, the total value of exports increased by 5.4 percent, and the volume of exports grew by 0.5 percent. The value of imports grew by 6.3 percent and the volume of imports by 6.7 percent compared to January-March of the previous year.
In March 2026, the trade balance showed a surplus of EUR 252 million. In January-March 2026, the trade balance had accumulated a deficit of EUR 904 million. The aggregated trade surplus decreased for industrial machinery and equipment, forest industry products and metals. The deficit increased for electrical machinery and equipment, as well as for food and beverages. The deficit decreased for crude oil and refined petroleum products, ores and metal scrap and transport equipment.
The terms of trade improved in March compared to the corresponding month of 2025 as import prices grew less than export prices. The point figure in March was 104.2, while it was 99.6 in March 2025. The terms of trade improved from February 2026.
Imports from EU member states are compiled with data collected with a new method starting in January 2026. Other EU-countries data on exports to Finland is used in imports compilation. Only total values of imports are comparable with the year 2025. Finnish Customs will not publish any other yearly percentage change figures of imports during the statistical year 2026. The unit cost- and volume indices of international trade in goods are calculated according to the new data collection method, the percentage chances are comparable. Read more: Impact of the change in the data collection method for imports on the international trade statistics of goods.
Value of exports of capital goods increased in March
The value of exports of capital goods grew by 11.0 per cent in March. The value of exports of industrial supplies grew by 3.7 per cent year-on-year. The value of exports of fuels and lubricants increased by 70.0 per cent. The value of exports of consumer goods increased by 94.8 per cent but the value of exports of transport equipment and parts declined by 14.0 percent. The value of exports of food and beverages increased by 7.4 percent.
Export volume to both EU countries and to countries outside the EU increased in March
The volume of exports to EU member states increased by 6.0 per cent and exports to other countries by 9.4 per cent in March. The volume of imports from EU member states increased by 5.8 per cent and from other countries by 5.6 per cent. In January–March, the volume of exports to EU countries decreased by 0.4 percent but grew to non-EU countries by 3.0 percent. The volume of imports from EU countries increased by 4.0 percent and from non-EU countries by 9.9 percent in January-March.
| Direction | March 2025 | March 2026 | Change % | January-March 2025 | January-March 2026 | Change % |
|---|---|---|---|---|---|---|
| Exports (fob) | 6 467 | 7 372 | 14,0 | 17 884 | 18 846 | 5,4 |
| Imports (cif) | 6 629 | 7 120 | 7,4 | 18 571 | 19 750 | 6,3 |
| Balance | -162 | 252 | -687 | -904 |
| Indices | March 2026 | Change % 2026:03/ 2026:02 |
Change % 2026:03/ 2025:03 |
January- March 2026 |
Change % 2026:01-03/ 2025:01-03 |
Mean* 2025:04-2026:03 |
|---|---|---|---|---|---|---|
| Volume index exports | 108,8 | 23,7 | 6,9 | 95,5 | 0,5 | 100,1 |
| Volume index imports | 108,2 | 11,8 | 5,7 | 102,4 | 6,7 | 101,4 |
| Unit value index exports | 109,3 | 6,4 | 6,8 | 105,8 | 4,7 | 101,0 |
| Unit value index imports | 104,8 | 3,2 | 2,0 | 102,3 | -0,6 | 99,8 |
* Moving 12-months averages
Terms
Next release
29.6.2026
Graphs
