Value of exports of goods decreased by 5.5 per cent in 2024, volume of exports fell by 3.5 per cent
According to preliminary data on international trade on goods available to Finnish Customs, the value of Finnish exports of goods decreased by 5.5 per cent in 2024. The volume of exports decreased by 3.5 per cent and the export prices declined by 1.8 per cent compared to 2023. The value of exports amounted to 72.2 billion euros. The value of imports decreased by 3.3 per cent in comparison with 2023. In terms of volume, imports diminished by 2.8 per cent, while import prices declined by 0.6 per cent. The value of goods imports amounted to 74.3 billion euros.
In the international trade in goods, 2024 was also a year of rather slow decline although the value of both exports and imports decreased less compared to the previous year. The volume of exports, decreased by 3.5 per cent. The decline of volume of exports was, however higher compared to 2.7 per cent decline in volume the previous year. The fall in both export and import prices stabilized compared to year 2023. Low value of exports of machinery, apparatus and transport equipment and decreasing export value of energy products contributed to the overall fall in exports.
According to preliminary data, the trade balance showed a deficit of 2.1 billion euros in 2024. The trade with EU countries had a deficit of 1.5 billion euros. Trade with non-EU countries showed a lower deficit, 590 million euros. The trade deficit was more moderate the year before, 488 million euros. In 2022, the trade deficit was record-high, 10.6 billion euros. The last time the trade balance experienced a surplus on an annual basis was in 2010.
Trade balance with China showed the largest deficit in 2024 according to preliminary data. The deficit amounted to 3.8 billion euros. Trade with Norway and Germany was also heavily in deficit. The largest surplus country by far was the United States, with a surplus of 3.2 billion euros. Trade balance was also in significant surplus in trade with the Netherlands, Belgium and United Kingdom.
.png/eda826a5-dc98-7aee-7cd4-9024dd2474e6?t=1738825209817)
Exports of chemical industry products increased in 2024
According to preliminary data, the export value of chemical industry products increased in 2024, especially exports of pharmaceutical products, the growth of these products was 23.4 per cent. The export value of other chemical industry products increased also. Of forest industry products, the export value of timber grew 3.1 per cent. The export value of paper and paperboard increased by 1.2 per cent, but that of paper pulp decreased by 5.8 per cent.
Exports of industrial machinery and apparatus decreased by 7.6 per cent and exports of electrical machinery and equipment by 1.0 per cent. The export value of energy products fell by a quarter and of metal industry products by 3.1 per cent. Exports of transport equipment fell also compared to the previous year.
The import value decreased in almost all the significant commodity classes, but imports of pharmaceutical products increased somewhat. The import value of other chemical industry products decreased. The fall in energy products import value was 8.7 per cent according to preliminary data. The imports of industrial machinery and equipment decreased by 0.7 per cent and the imports of electrical machinery and equipment by 5.8 per cent. Imports of metal industry products fell also except imports of copper, which grew by 27.4.
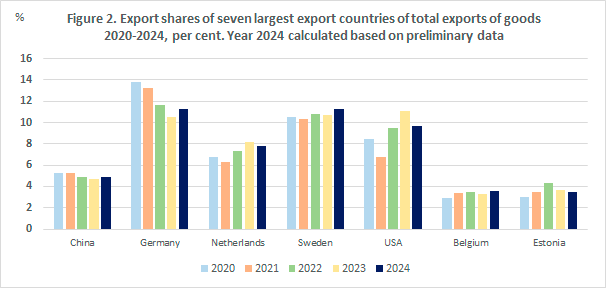
Sweden was the largest export country in 2024
Sweden became our largest trading partner for exports in 2024 according to preliminary data. The value of exports to Sweden was near the level of previous year (-0.1%) and the share of total exports of goods was 11.3 per cent. The year before Sweden was the second largest trading partner for exports. In 2024, Germany was the second largest trading partner for exports with a share almost as large as that of Sweden, 11.2 per cent. The value of exports to Germany increased slightly, by 0.8 per cent. The United States had the third place in 2024, the export value fell by 17.9 per cent and the share of total exports was 9.7 per cent. The United States was our largest trading partner for exports in 2023, a cruise ship export to the country contributed heavily. The Netherlands had the fourth place with a share of 7.8 per cent, although exports declined by 10.0 per cent. China’s share of total exports was 4.9 per cent and exports decreased by 1.5 per cent. The share of both Belgium and Estonia was 3.5 per cent. The export value to Belgium increased by 2.4 per cent, but decreased to Estonia by 10.8 per cent.
The aggregated share of these seven largest export countries of the total export value was over half, or 51.9 per cent. The share of ten largest export countries was as high as 61.8 per cent.
Germany was the largest import country in 2024
Germany was our largest trading partner for imports in 2024 according to preliminary data and the share of total imports of goods was 14.0 per cent. Sweden was the second largest import country with a share of 11.6 per cent. The value of imports from Germany decreased by 4.1 per cent and from Sweden by 1.7 per cent. The third largest import country was China with a share of 9.9 per cent. The value of imports from China grew by 2.6 per cent in 2024. Imports from Norway fell by 6.8 per cent and the share of total imports was 7.4 per cent. The share of the Netherlands was 5.4 per cent and imports decreased by 1.7 per cent. The United States was the sixth largest trading partner for imports with a share of total imports of goods of 5.1 per cent. The value of imports decreased by 9.8 per cent.
The aggregated share of these six largest import countries of the total import value was 53.4 per cent.
Both value of exports to and imports from EU countries decreased more slowly than that of external trade
Based on preliminary data, the value of exports to the EU countries decreased by 3.2 per cent in 2024. The value of exports to the eurozone fell by 3.9 per cent. The value of exports to non-EU countries declined by 8.5 per cent. The value of imports from EU countries increased by 2.3 per cent, from the eurozone by 2.7 per cent, and from non-EU countries by 4.8 per cent.
The EU countries’ share of Finland’s goods exports was 58.0 per cent in 2024, calculated based on preliminary data. This was an increase from the share of 56.6 the year before. The EU share of Finland’s imports of goods was 58.4 per cent in 2024. The shares of the trade with countries outside the EU changed correspondingly. In 2024, the share of external trade of exports was 42.0 per cent and 41.6 per cent of imports.
| Direction | Statistical value MEUR 2024 | Change % | Unit Value Index Moving 12-month average 2020=100 | Unit Value Index Annual change of moving average % | Volume index Moving 12-month average 2020=100 | Volume index Annual change of moving average % |
|---|---|---|---|---|---|---|
| Exports (fob) | 72 165 | -5,5 | 133,9 | -1,8 | 93,5 | -3,5 |
| Imports (cif) | 74 280 | -3,3 | 135,2 | -0,6 | 90,4 | -2,8 |
Enquiries:
Telasuo, Christina tel. +358 40 332 1828
Kaarna, Anssi tel. +358 40 332 8153
E-mail: firstname.surname[at]tulli.fi