Preliminary statistics on the international trade in goods, July 2024
6.9.2024 9.00
Finnish Customs, Statistics
Export volume increased by 17.0 per cent in July according to preliminary data
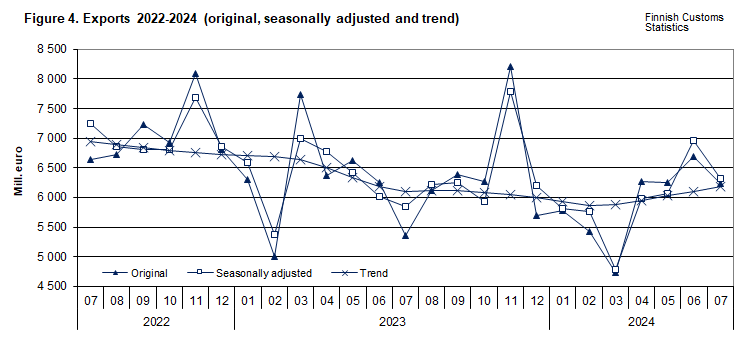
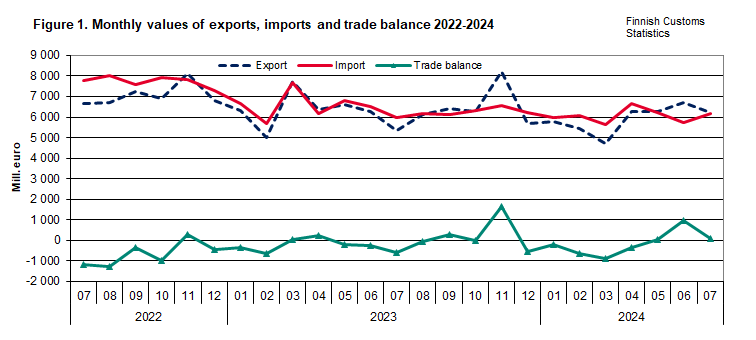
According to the preliminary statistics of international trade in goods provided by Finnish Customs, the value of Finnish exports increased by 16.6 per cent in July year-on-year. The value of Finnish exports in July was EUR 6.2 billion. Export volume increased by 17.0 per cent, and export prices increased by 0.8 per cent year-on-year.
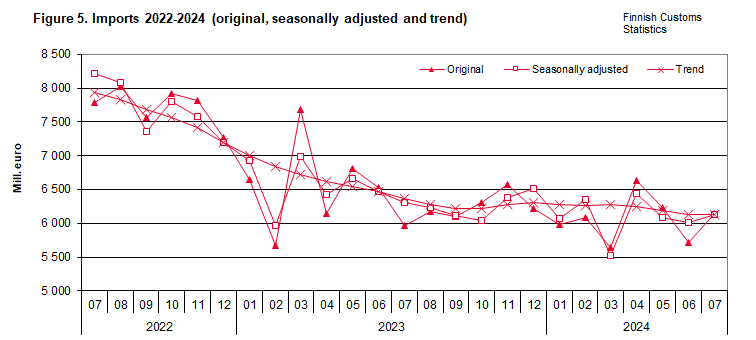
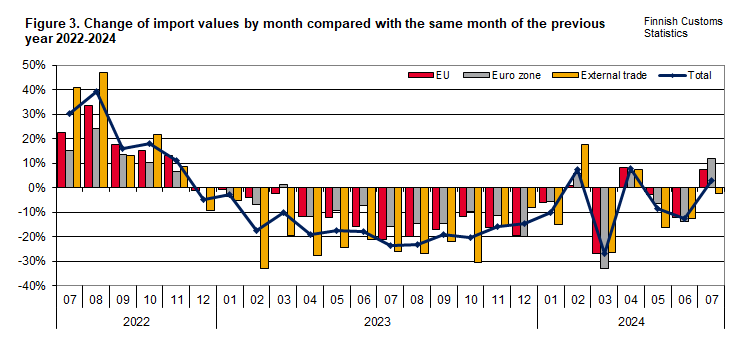
The value of imports increased by 3.1 per cent in July and the value of imports was EUR 6.2 billion. Import prices increased by 3.0 per cent, and import volume increased by 1.0 per cent compared to July 2023.
In January-July 2024, the total value of exports decreased by 5.2 per cent and the value of imports by 6.7 per cent year-on-year. Change of export volume during the latest 12 months was -2.1 per cent (12 month moving average August 2023 – July 2024). The corresponding figure for import volume was -7.5 per cent.
The trade balance was in surplus of EUR 90 million in July. In January-July, the aggregated deficit amounted to EUR 1.0 billion. In July 2023, the trade balance was EUR 614 million in deficit and in January-July of the same year, the aggregated deficit was EUR 1.8 billion.
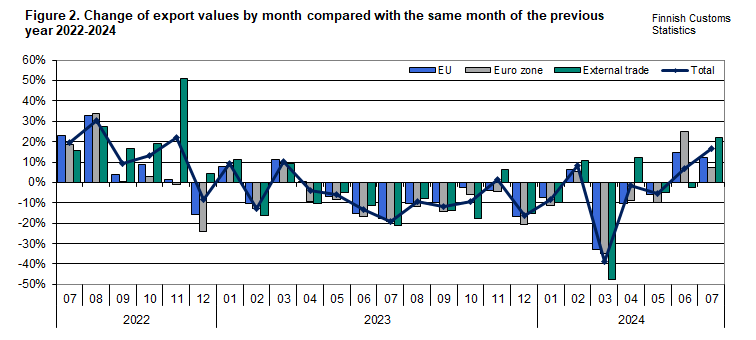
Both the volume of internal and external exports increased in July
Value of exports to EU member states increased by 12.4 per cent and to non-EU countries by 21.9 per cent in July compared to the same month the previous year. The volume of exports to EU countries increased by 16.8 per cent, and to non-EU countries by 15.3 per cent during the same time.
Calculated from the beginning of the year, value of exports to EU countries decreased by 5.2 per cent and to non-EU countries by 5.1 per cent. The volume of exIn this publication preliminary statistics under table 6 are listed export and import values and percentage change by country. The values in the table are preliminary and significant changes are possible when data becomes more complete.ports to EU member states decreased by 0.5 per cent, and the volume of exports to non-EU countries decreased by 4.5 per cent calculated according to 12-month moving average.
Value of imports from EU countries increased by 7.6 per cent, but decreased from non-EU countries by 2.3 per cent in July. The volume of imports from EU member states increased by 8.2 per cent, but decreased from non-EU countries by 3.2 per cent.
Calculated from the beginning of the year, value of imports from EU member states decreased by 5.6 per cent and from other countries by 8.2 per cent. The volume of imports from EU member states decreased by 5.2 per cent, and the volume of imports from non-EU countries by 9.0 per cent calculated according to 12-month moving average.
In this publication preliminary statistics under table 6 are listed export and import values and percentage change by country. The values in the table are preliminary and significant changes are possible when data becomes more complete.
Terms
Next release
7.10.2024
Graphs