Preliminary statistics on the international trade in goods, March 2024
8.5.2024 9.00
Finnish Customs, Statistics
Export volume decreased by 36.8 per cent in March according to preliminary data
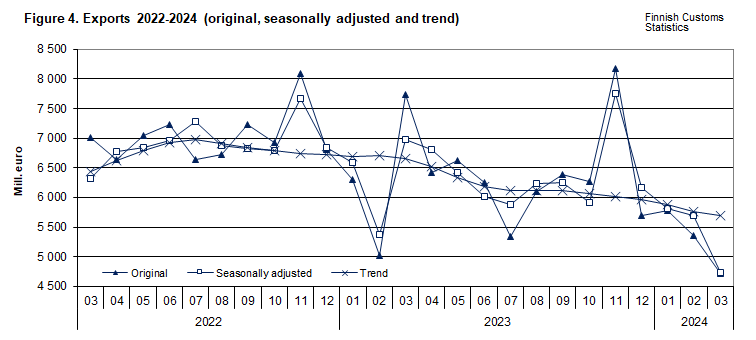
According to the preliminary statistics of international trade in goods provided by Finnish Customs, the value of Finnish exports decreased by 39.1 per cent in March year-on-year. The value of Finnish exports in March was EUR 4.7 billion. Export volume decreased by 36.8 per cent and export prices declined by 3.4 per cent year-on-year.
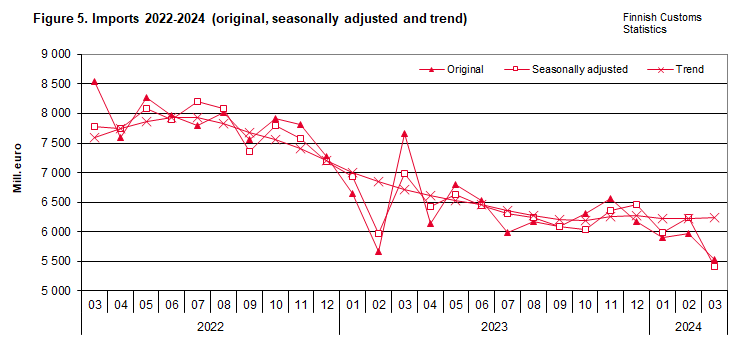
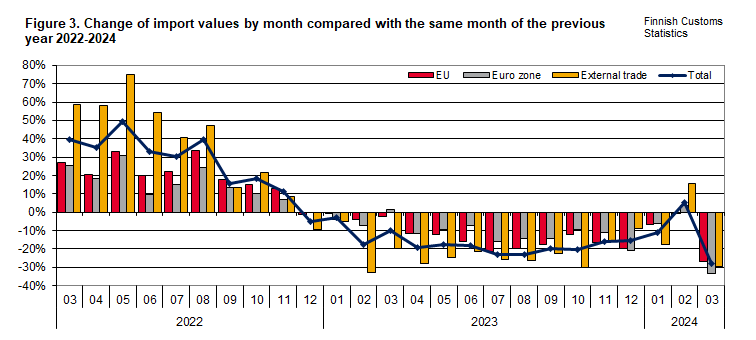
The value of imports decreased by 28.0 per cent in March and the value of imports was EUR 5.5 billion. Import prices declined by 1.9 per cent and import volume by 26.3 per cent compared to March 2023.
In January-March 2023, the total value of exports decreased by 16.8 per cent and the value of imports by 12.9 per cent year-on-year. Change of export volume during the latest 12 months was -5.0 per cent (12 month moving average April 2023 – March 2024). The corresponding figure for import volume was -10.3 per cent.
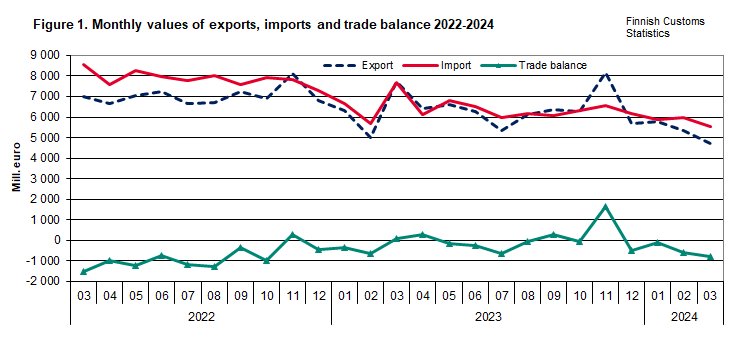
The trade balance was in deficit of EUR 810 million in March. In January-March, the aggregated deficit amounted to EUR 1.5 billion. In March 2023, the trade balance was EUR 70 million in surplus and in January-March of the same year, the aggregated deficit was EUR 920 million.
The four week long harbor strike, which started on March 11th 2024, reduced significantly international trade in goods. A two-week harbor strike the year before in February resulted in exceptional high values of export and import values in March 2023 when the harbors operated again. The decline in values of international trade in goods in March 2024 compared with March the year before was therefor particularly deep. When comparing the change in the export value with February the same year, value of exports decreased by 12.1 per cent and value on imports by 7.5 per cent.
Volume of both internal and external exports decreased
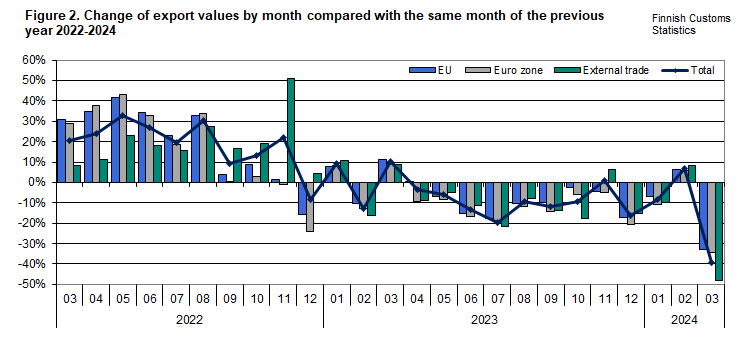
Value of exports to EU member states decreased by 33.0 per cent and to non-EU countries by 48.1 per cent in March compared to the same month the previous year. The volume of exports to EU countries decreased by 29.6 per cent and to non-EU countries by 47.6 per cent during the same time.
Calculated from the beginning of the year, value of exports to EU countries decreased by 14.3 per cent and to non-EU countries by 20.4 per cent. The volume of exports to EU member states decreased by 2.5 per cent, and the volume of exports to non-EU countries decreased by 8.4 per cent calculated according to 12-month moving average.
Value of imports from EU countries decreased by 26.9 per cent and from non-EU countries by 29.5 per cent in March. The volume of imports from EU member states decreased by 24.9 per cent and from non-EU countries by 26.2 per cent.
Calculated from the beginning of the year, value of imports from EU member states decreased by 12.8 per cent and from other countries by 13.2 per cent. The volume of imports from EU member states decreased by 7.3 per cent, and the volume of imports from non-EU countries by 13.6 per cent calculated according to 12-month moving average.
In this publication preliminary statistics under table 6 are listed export and import values and percentage change by country. The values in the table are preliminary and significant changes are possible when data becomes more complete.
Terms
Next release
6.6.2024
Graphs