Preliminary statistics on the international trade in goods, December 2021
7.2.2022 9.00
Finnish Customs, Statistics
Exports increased by 18.2 per cent in December
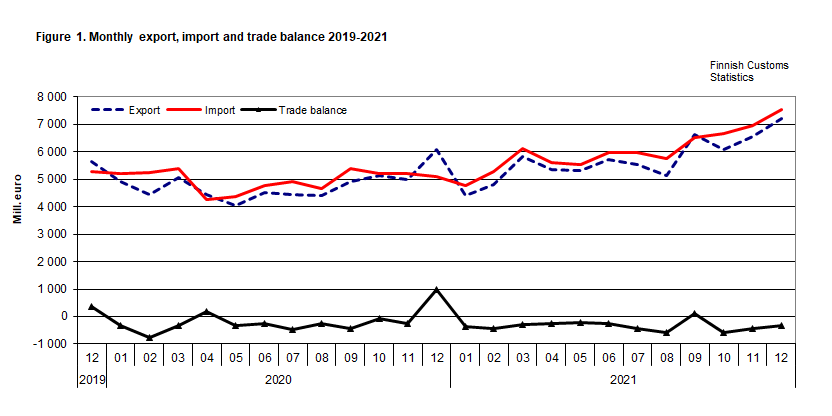
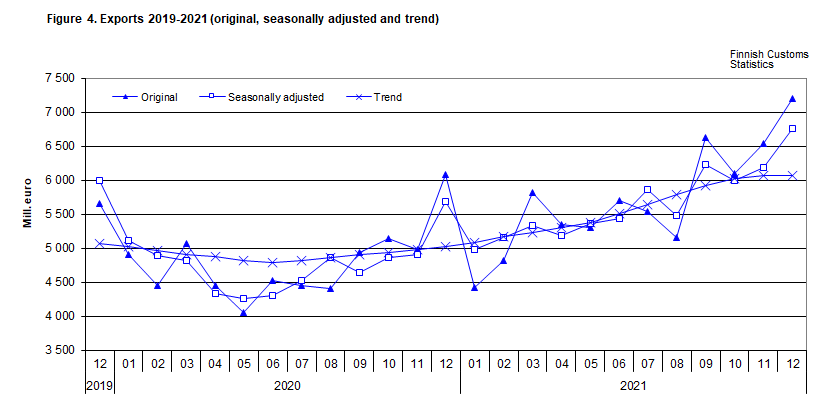
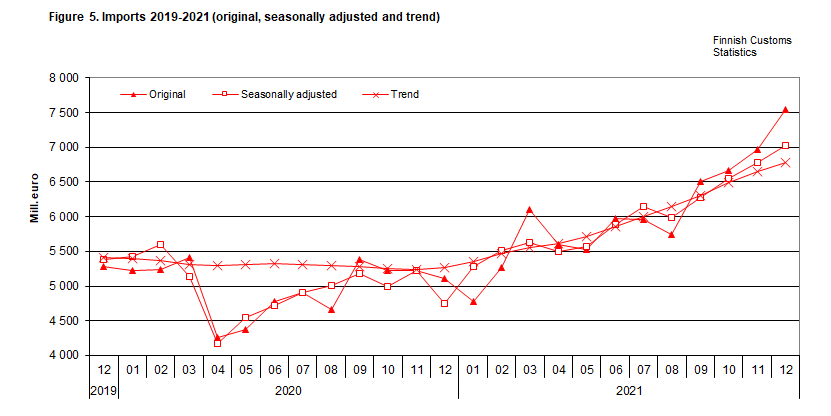
According to the preliminary statistics of international trade in goods provided by Finnish Customs, the value of Finnish exports increased by 18.2 per cent, and the value of imports by 47.8 per cent in December year-on-year. The value of Finnish exports in December was EUR 7.2 billion and the value of imports EUR 7.5 billion. During the reference month in 2020 exports increased by 7.7 per cent, but imports decreased by 3.5 per cent.
In January-December 2021, the total value of exports increased by 19.4 per cent and the value of imports by 21.5 per cent year-on-year.
The trade balance was in deficit of EUR 345 million in December. In January-December, the deficit amounted to EUR 4.1 billion. In December 2020, the trade balance was EUR 986 million in surplus, but in January-December of the same year it was EUR 2.3 billion in deficit.
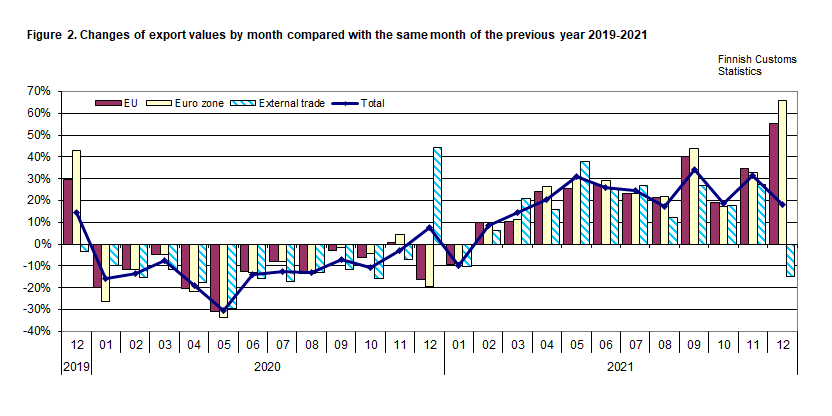
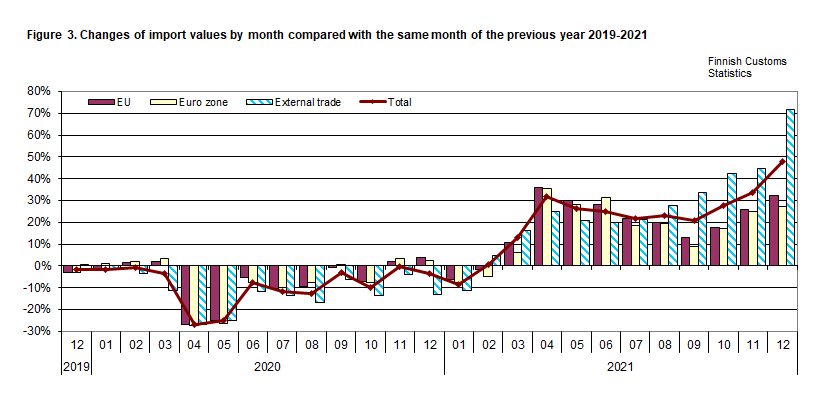
Exports to EU member states increased by 55.1 per cent, but exports to non-EU countries decreased by 14.8 per cent in December. Imports from EU countries increased by 32.4 per cent and imports from non-EU countries by 71.9 per cent. Calculated from the beginning of the year, exports to EU countries rose by 23.6 per cent and to non-EU countries by 14.4 per cent. During the same period, imports from EU member states rose by 18.4 per cent and from other countries by 26.1 per cent.
Further information:
Kaarna, Anssi tel. +358 40 332 8153
Telasuo, Christina tel. +358 40 332 1828
E-mail: forename.surname[at]tulli.fi
The monthly preliminary statistics release contains preliminary overall figures about Finland's international trade in goods. More precise figures of exports and imports as well as detailed statistics about specific countries and goods will be published at the end of the month in the monthly statistical release.
Terms
Next release
8.3.2022
Graphs