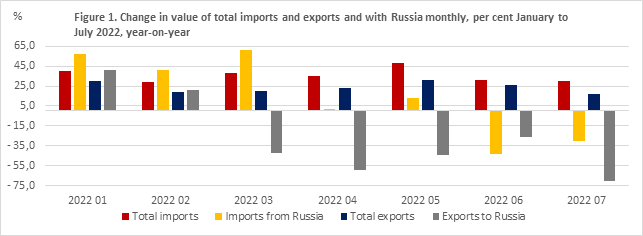
Value of exports to Russia decreased in July 2022 by 71 per cent and value of imports by 31 per cent
The value of Finland’s exports of goods to Russia decreased 71 per cent in April 2022 in comparison to the corresponding period in 2021, as indicated by the preliminary international trade in goods statistics compiled by Finnish Customs. The value of exports amounted to 95.6 million euros. The value of Finland’s imports from Russia decreased by 31 per cent in July to 424.4 billion euros. In comparison to June 2022 the value of exports diminished by 61 per cent and the value of imports by 29 per cent. Exports to Russia decreased already from March, but the value of imports turned downwards only in June. The significant rise in prices of energy products increased the value of imports from March. The volume of imports was declining at the same time.
In July, when measured in euros, a significant drop in exports to Russia (-45.5 MEUR and -65 %) occurred in the CN category of machinery and mechanical appliances and parts thereof, on which the EU has placed the majority of export sanctions. In terms of percentage, a large drop took place also in the category of electrical equipment and parts thereof (-92 %), also subject to a significant number of EU export sanctions. In exports of transport equipment to Russia occurred a similar drop in July.
Also in terms of percentage, the export value of forest industry product decreased the most, by 96 per cent. Exports declined in almost all other goods categories as well, apart from exports of animal- and vegetable products which increased by 36 per cent from 2021. The value of exports of oil products to Russia decreased by 80 per cent and of chemical industry products by 62 per cent.
The value of crude oil imports decreased by 30 per cent and the import quantity by 45 per cent in July compared to same month the previous year. In May 2022, no crude oil was imported from Russia and in June, the import value was only 73 million euros. Compared to June, the imports of crude oil from Russia increased by 56 compared in July. Imports of crude oil from Russia has mainly been replaced with imports from Norway. The imports of refined oil products from Russia increased in July by 70 per cent year-on year. Compared to June the increase was even more significant, 242 per cent.
Imports of wood from Russia decreased by 89 per cent in July and imports of pulp, paper, paperboard, etc. by 96 per cent. No new agreements were made according to EU sanctions. Imports of these commodities finished on July 10. Imports of new pneumatic tyres on contrary increased by 162 per cent in July year-on-year, but decreased compared to June by 27 per cent. Also imports of tyres from Russia came to an end on July 10.
No natural gas nor electric energy was imported from Russia from June and onwards. Imports of fertilisers and copper reached zero in July. A notable increase in imports of nickel and nickel goods occurred though in July. Their value increased by 67.2 million euros and 73 per cent in comparison with last year. The import quantity of nickel and nickel goods rose also significantly.
The share of exports to Russia of total trade has diminished under the first half-year of 2022 to 3.5 per cent from 5.4 per cent during the year 2021. Concerning imports, the corresponding share dropped to 9.4 per cent from 11.8 per cent.
– In July, the value of imports from Russia was 56 per cent less than in February and the value of exports more than 70 percent less. In August, trade was still decreasing. In imports from Russia, nickel mattes is now the highest valued single import commodity, says Mr Olli-Pekka Penttilä, Director of Statistics.
Up-to-date traffic information for the Finnish-Russian border
During weeks 1-9/2022, an average of about 22 vessels per week arrived in Finland from Russian ports. During weeks 19-22/2022, the average dropped to eight vessels. From July, the average was only four vessels per week. During the last four weeks, 86 per cent fewer vessels arrived from Russian ports compared to previous year.
At the Finnish-Russian border, during July 2022, the arrivals of loaded train cars dropped by 73 per cent from corresponding period last year. The train traffic ended at Imatra border crossing point in April and in Vartius in June. Calculated from January to August arrivals of loaded train cars decreased by 44 per cent.
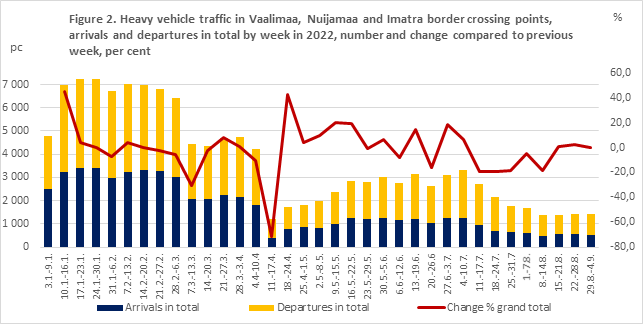
The average weekly number of trucks arriving at the three main border crossing points on the Finnish-Russian border, namely Vainikkala, Imatra and Nuijamaa, was 3 175, whereas during weeks 19-22 the average number of trucks was 1 175. Since Saturday 9 April 2022 on week 14, Finnish Customs has turned back all commercial transports carried by vehicles registered in Russia and Belarus. The transports has been replaced by vehicles registered in Finland and to vehicles registered in Baltic countries. Traffic with trucks recovered somewhat during May and June but a downward turn can be observed after 10. July 2022.
| CN-class | May Preliminary value milj.eur |
June Preliminary value milj.eur |
July Preliminary value milj.eur |
Change % |
|---|---|---|---|---|
| 01-24 Animal- and vegetable products | 5,2 | 12,2 | 12,3 | 36% |
| 25-27 Mineral products | 4,0 | 5,2 | 5,9 | -78% |
| 2710 Oil products | 3,5 | 4,1 | 5,2 | -80% |
| 28-38 Chemical industry products | 13,8 | 19,2 | 11,0 | -62% |
| 39-40 Plastics and -articles, rubber and -articles | 10,8 | 15,7 | 7,1 | -72% |
| 47-49 Pulp, paper, paperboard, -articles | 8,0 | 7,8 | 1,6 | -96% |
| 50-67 Textiles, footwear | 2,2 | 2,1 | 2,4 | -21% |
| 72-83 Base metals and -articles | 67,1 | 57,1 | 17,9 | -64% |
| 7401 Copper mattes | 63,3 | 47,0 | 11,0 | -65% |
| 84 Machiner och mechanical appliances, -parts | 51,6 | 99,4 | 24,0 | -65% |
| 85 Electrical machinery, -parts | 1,7 | 4,1 | 2,8 | -92% |
| 86-89 Transport equipment | 1,3 | 1,6 | 1,6 | -92% |
| 90-92 Optical and medicinal instruments and apparatus, etc | 1,3 | 15,0 | 3,8 | -43% |
| Other CN-classes | 4,6 | 4,3 | 5,1 | -49% |
| Total | 171,5 | 243,5 | 95,6 | -71% |
| CN-class | May Preliminary value milj.eur |
June Preliminary value milj.eur |
July Preliminary value milj.eur |
Change % |
|---|---|---|---|---|
| 01-24 Animal- and vegetable products | 8,0 | 3,4 | 0,1 | -99% |
| 25-27 Mineral products | 294,1 | 168,4 | 212,3 | -35% |
| 2701 Coal | 25,5 | 55,0 | 3,9 | -42% |
| 2709 Crude oil | 0,0 | 73,3 | 114,6 | -30% |
| 2710 Oil products | 99,6 | 24,1 | 82,4 | 70% |
| 2711 Natural gas | 135,6 | 0,0 | 0,0 | -100% |
| 2716 Electrical energy | 24,6 | 0,0 | 0,0 | -100% |
| 28-38 Chemical industry products | 33,4 | 25,9 | 25,1 | -55% |
| 31 Fertilisers | 0,4 | 2,5 | 0,0 | -100% |
| 39-40 Plastics and -articles, rubber and -articles | 10,3 | 23,5 | 14,0 | 59% |
| 4011 New pneumatic tyres, rubber | 8,5 | 16,9 | 12,4 | 162% |
| 44-46 Wood and -articles | 12,9 | 13,2 | 6,0 | -89% |
| 47-49 Pulp, paper, paperboard, -articles | 0,8 | 1,5 | 0,1 | -96% |
| 72-83 Base metals and -articles | 65,7 | 83,1 | 161,2 | 11% |
| 72 Iron and steel | 10,7 | 10,2 | 0,5 | -98% |
| 73 Articles of iron and steel | 2,2 | 4,7 | 0,8 | -91% |
| 74 Copper and articles of copper | 2,8 | 3,0 | 0,0 | -100% |
| 75 Nickel and articles of nickel | 42,9 | 59,0 | 159,6 | 73% |
| 84 Machiner och mechanical appliances, -parts | 18,4 | 0,5 | 0,5 | -58% |
| 85 Electrical machinery, -parts | 3,5 | 3,6 | 2,0 | -54% |
| Other CN-classes | 6,7 | 6,4 | 3,1 | -47% |
| Total | 453,8 | 329,4 | 424,4 | -31% |
The numbers in tables 1 and 2 comprise preliminary data, and changes may occur as data is completed.
More information:
Mr Olli-Pekka Penttilä, Director of Statistics, tel. 040 332 18 62, olli-pekka.penttila@tulli.fi, on Twitter @Penttila_Olli